Location, location, location has long been the mantra in the real estate industry; now, it may be data, data, data.
Big data acquisition and algorithmic analysis are transforming the real estate business, as they are many other endeavours. The market for location intelligence and location-based data services is seen as a multi-billion dollar opportunity, set to eclipse $43 billion USD across North America by 2019.

Traditional real estate data points, such as lease expiry dates and rental values, can be combined with social, economic and even political information and then displayed as rich visualizations using big data analysis techniques and technologies.
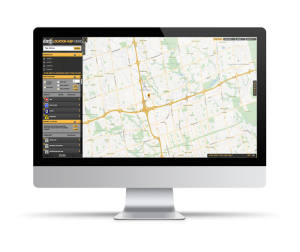
Not surprising then that leading location intelligence and data process providers are beefing up their technology and service offerings. To support the Canadian real estate data market, a new multi-function data visualization platform has been launched by DMTI Spatial, a Markham, ON-based location data company.
UPDATED July 14 – DMTI Spatial has been acquired by a U.S.-based company. Irvine, CA.-based Digital Map Products, a leading provider of location technology and data in that country, announced the acquisition on July 12. Financial terms were not disclosed, but Digital Map Products has received a strategic growth investment from Silversmith Capital Partners reported to be $36.3 million. DMTI will continue to operate out of its office in Canada, a representative noted.
Incorporating enhanced data about the entire Canadian condo market provided by real estate company Teranet Inc., DMTI’s Location Hub provides national insights down to the condo building and unit level. (DMTI Spatial, a member of the Neopost Group, maintains GIS location-based data in Canada and it provides popular CanMap mapping solutions. Teranet is the exclusive provider of online property search and registration in Ontario and The Property Registry in Manitoba.)
Visualizing Real Estate Data on Multiple Screens
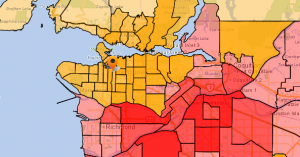
The data available on Location Hub can be presented as colourful maps, with user-customizable display parameters for several information categories in the overall data schema.
The platform serves up its data to any connected PC or mobile device. It’s also available to users through an API (or Web service) on a transactional basis; as a software-as-a-service (SaaS) platform, it integrates with existing IT systems.

Real estate data comes from a variety of open, public and private data sources, and is aggregated, standardized and provided as value-added information back to the market.
All real estate produces lots of microdata; from occupancy rates to maintenance issues – how often the elevator breaks down – for example. More broadly, the database contains demographic and firmographic statistics, as well as environmental risk information including Canadian flood data, earthquake boundaries and more. Traditional real estate data points, such as lease expires and rental values, can be combined with social, economic, geographical and even political information in such databases.
Data available through the Location Hub comes from a variety of open, public and private data sources, described DMTI’s Director of Product Management, Robert Szyngiel, which are then aggregated, standardized and provided as value-added information back to the market.
On Location Hub, the initial database offering contains more than 90,000 unique condo buildings located anywhere in Canada, Szyngiel added, providing coverage of over 700,000 individual units.
And while the consumer condo market is on fire in many cities, some of the most frequent users of location data are property insurers, lenders and real estate analysts.
The new visualization and analytical tool enables them to determine the number of condo buildings in a specific market, the number of units within a condo building, and how many condos and units are in a specific database. That knowledge helps create value as users better understand market share, potential revenue opportunities and risk exposure.
 For example, prospective investors analyze how sound a physical structure is, when it was last renovated or if the prospective owner is financially reliable—important factors that impact business decisions.
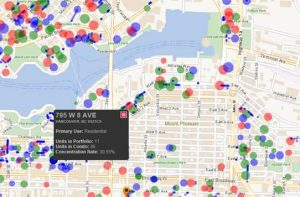
As informative as relevant and robust data can be, users often get more out of the analytical experience when query results are presented in a visual manner. As Szyngiel showed, the Location Hub platform provides a base map on which condo information, such as the number of units, is graphically overlaid.
 There is also satellite imagery available, which can be added as a backdrop to see more details associated with a building.
Visualization snapshots like those above use colour to represent how many units are currently customers of the user of the database and the size of the circle to represent the number of units within a building, or to highlight regional differences in population and building density. Users can identify revenue opportunities by targeting those in a general area or a specific building with which they are not currently doing business.
Risk challenges from environmental factors can also be identified by the system, and historical and meteorological data is used to identify earthquake zones, flood patterns and more. Ancillary services on the platform provide automatic event notifications and real-time updates with text and visual-based insights into the duration, size, impact and number of addresses affected by either natural or man-made occurrences.
# # #
Big Data Guidelines Released
The real estate industry is one of many sectors that is taking advantage of the business intelligence generated by big data acquisition and algorithmic analysis; recognizing the transformational trends underway, the Information and Privacy Commissioner of Ontario has just released new Big Data Guidelines that outline key issues to consider and best practices to follow when undertaking big data projects.
-30-


STORY UPDATED July 14 – DMTI Spatial has been acquired by a U.S.-based company. Irvine, CA.-based Digital Map Products, a leading provider of location technology and data in that country, announced the acquisition on July 12. Financial terms were not disclosed, but Digital Map Products has received a strategic growth investment from Silversmith Capital Partners reported to be $36.3 million. DMTI will continue to operate out of its office in Canada, a representative noted.