If you’ve ever sent an e-mail or visited a website – like one hundred per cent of you – you have transmitted data.
But where did that data go, what route did they take, whose hands were they in?
Now, you can track the packets that make up your personal data transmissions.
The Ontario Science Centre is hosting a revealing live tech demo called ‘Picture the Internet.
A public technology demonstration taking place this weekend in Toronto aims to “demystify the Internet” by tracking and mapping your data.
By following the data packets that make up your Internet activity, by showing their route on an actual map, the people staging the demo plan to stir up some conversation about how the Internet really works, where our data really goes, and what that means for us.
“Picture the Internet” is the Ontario Science Centre’s evocative name for a highly technical process.
But, at a demo planned for this Saturday, October 13th, organizers and researchers will do more than just picture it; they’ll describe its inner workings in ways that may leave you a little uneasy.
The demo is of the in-progress activities of unique Canadian tech project called IXMaps, and the new interactive tool it developed to show what’s inside the Internet, and how data is handled behind the scenes.
Their technical demonstrations and data visualizations are a really good fit at the Science Centre, as Kevin von Appen, Science Communication Director there, explains.
“We want to spark questions, curiosity and dialogue around issues in science and technology that impact our visitors’ lives,” he said in the days leading up to the special event. “We’re hoping that by engaging visitors with the IXMaps project, we’ll help create dialogue around both the workings and the social and political implications of the Internet.”
Andrew Clement, Professor at the Faculty of Information at the University of Toronto and Nancy Paterson, Associate Professor, OCAD University, are heading up the IXMaps project, and leading the team that created that interactive tool in the first place, and then posted it online at the IXMaps website.
Now, they’re bringing it to the Science Centre.
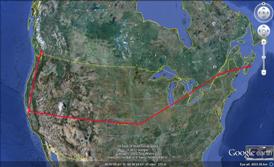
IXMaps offers an online tool that can track the packets that make up your e-mails and website requests.
IX, or IXP, is shorthand for Internet exchange points, actual physical buildings with servers, routers and switches that do the heavy lifting of the Web.
IXPs are where one Internet Service Provider’s network meets up with another operator’s network. IXPs pass along your data – it’s called peering – based on technical, financial and/or jurisdictional agreements.
But the longer the route between or among peering networks, the longer a transmission will take: data latency or lag will increase, and websites will be slower to load.
What’s more, the international nature of Internet traffic and cloud computing means that personal data and confidential business communications often cross borders and reside on servers in other jurisdictions, other countries.
The amount of data Internet traffic these interconnections points handle every day is staggering: some IXs are rated at two Tbit/s (terabits per second) throughput, exchanging some 12 petabytes of data per day.
Staggering, and concerning, as IXMaps co-leader Paterson sees it.
“Where is your own personal data when it goes into the cloud? The data path of a request to view a website is actually closely held information,” she says, adding that some even call it the ‘black art of the Internet’.
“This demo is aimed at demystifying the Internet and making its technical processes more transparent to end users like us.”
It seems the IXMap team is not alone in seeking transparency: in fact, the Office of the Privacy Commissioner of Canada wants it, too.
The federal office is providing $500,000 this year for research and awareness projects that look at important privacy issues: IXMaps is among those selected.
IXMaps gets support for its ‘Mapping Canadian Privacy Risks in the Internet Cloud’ project, and to conduct an information session about Internet routing, cloud computing and the privacy implications for Canadian users.
Hence, the Science Centre event.
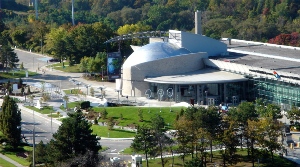
The Science Centre in Toronto is well known for its science, technology and Internet exhibitions.
It’s not the first time the OSC has looked into the Internet; in fact, it was one of the first places you could go to get on the ‘Net.
“The Science Centre created a major exhibition hall called ‘Info Highway’ that explored the Internet and its structure, while offering the first publicly-accessible free Internet cafe in Toronto, back in the mid-‘90s, as the World Wide Web exploded into popular culture,” recalled von Appen
The exhibit was eventually decommissioned as the Web became ubiquitous in all our lives, but the Science Centre continued to explore various technologies and look at issues around the Internet through public programs and events since then.
This time, the Science Centre along with the IXMaps team are looking ‘under the hood’ as it were, and hoping to show the interconnections between data transmission, personal privacy and Canada’s Internet sovereignty.
# # #
While preparing for this event, I received a note from a team of designers and researchers at open-site.org, who’ve put together a new ‘infographic’ showing how the Internet works. It’s completely separate from the IXMaps initiaitive, but it does present helpful concepts for understanding some structures and workflows engineered into the Internet.
-30-
submitted by Lee Rickwood


We have satellite service for the Internet? What about that?