The cyclists are fast, but the data is even faster.
As the 105th edition of the Tour de France speeds its way across the alluring French countryside, data is streaming from devices attached to each cycle participating in the month-long race. But from the back of the seat to the front of your digital screen, barely seconds elapse.
Literally millions of data points are being transmitted so real-time race updates and statistical visualizations can be watched by viewers all over the planet. Race fans also use official social channels like @letourdata as well as a dedicated website and mobile device apps to keep track of their favourite riders (or to keep a wary eye on the competition).

Tour de France fans have multiple digital platforms and social channels available to keep track of the race results.
Video streams of the official TV coverage as well as shots from on-board cameras are on the race app, and users can set-up a number of alerts and notifications to get the latest about their favourite rider, team or stage.
But there’s also a world of predictive data reports and live tracking features.
The Tour’s digital platforms not only enable fans to track the position and speed of specific cyclists in real time, they make use of machine learning and AI techniques in order to predict race developments and stage outcomes. Advanced analytics and coded algorithms incorporate historical rider data with actual race conditions to make data-driven race predictions like the estimated time of arrival at key points in the race, and when or if the peloton is likely to catch the breakaway group.
The collected data and subsequent analysis are also incredibly valuable to the racers and cycling teams, providing a way to monitor athletic performance and to evaluate competition strategy, tactics and of course, results.
What’s more, the use of actual race data lets the race organizer open up new revenue streams based on a growing worldwide interest in and consumption of data from not just cycle racing, but almost every professional sport.
In fact, second-screen viewing of the world’s most well-known cycling event has increased by more than fifty per cent in just three years. Just as exciting for race promoters and program marketers is the Tour’s reported 6.5 million followers on social media: younger fans – 18 to 35 – make up three quarters of that audience.
So it is not surprising that race organizer Amaury Sport Organisation (A.S.O.) has again partnered with global data technology company Dimension Data as a way to keep existing fans connected while also engaging even more people in the excitement, drama and statistical one-upmanship that surrounds the race.
The two companies have been working together on the digital data side of the Tour for three years now, and the results show why the partnership continues: visits to the Tour website have increased by 15 per cent year-over-year, and Tour de France online video views have risen from six million before the partnership to more than 71 million last year.
“Since becoming the official technology partner of the Tour de France in 2015, Dimension Data has had a major influence on the increased digitization of race data,” explained Julien Goupil, Media Director at A.S.O. in a release. “It is extremely encouraging to see the increasing number of younger fans we are engaging across our digital channels.”
Transmitters are attached to every cycle in the race so that real time updates and big data analytics can be brought to bear.
This year, the data will be streaming to those digital channels as well as broadcasters and sports specialty channels around the world (in Canada, Sportsnet has the TV coverage).
If you’ve been watching, you will have noticed the small black extension sticking out from underneath each bike’s saddle seat; that’s the Fox. The transmitter is made by a French company called HiKob; Peter Gray, Dimension Data’s technical team lead for this year’s Tour, says it is smaller and lighter than previous versions, but more capable. It has not only GPS sensors, but various inertial measurement capabilities (like 3D accelerometers, gyroscopes and a magnetometer).
It’s got a transmission range of one kilometer (as opposed to previous unit with a 100 m range), and it connects with a wide wireless area network – or WWAN – based on project standards for 3G (3GPP 802.15.4). The standard is used to create a mesh network between telemetry devices and relay points.
Dimension Data analyzes over 150 million data points on each stage of the race, so those relay points are crucial: the data transmission path is as complex as the race course itself (and there are variable distances and uneven terrains to deal with along the way). From the transmitter to nearby motorized vehicles (when necessary, motorbikes or other cars are used), the data stream is literally uploaded to overhead helicopters or fixed-wing aircraft equipped with receivers and transmitters. It’s all about getting good line-of-sight transmissions back to the nerve centre, a big rolling truck that follows the race everywhere.
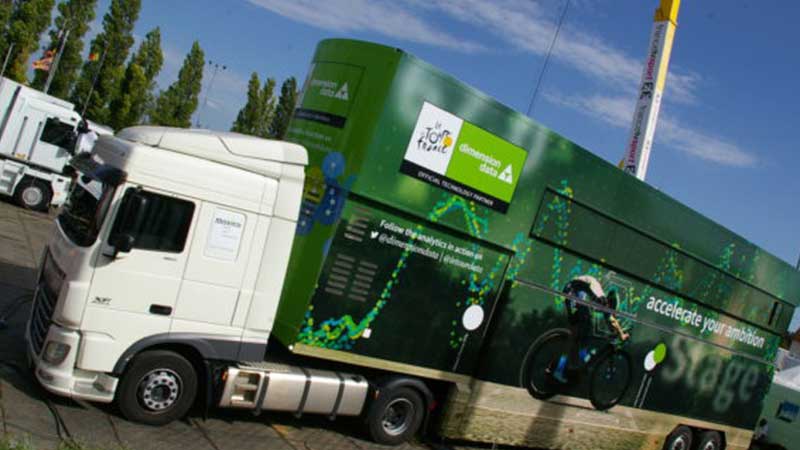
Dimension Data’s big data truck follows the Tour de France riders everywhere.
That big data truck is where Dimension Data’s technical, communications and live data reporting teams come together, and it’s the last data jumping off point before reaching Dimension Data’s global cloud platform.
Tim Wade, Senior Director of Technology and Architecture Consulting at Dimension Data, described some of the data handling, processing and protecting that happens along the way, explaining that data from the rider-tracking devices (once ingested and processed) is encrypted and sent over networks that are not Internet-connected.
With the value of that data top of mind, Wade says his team takes “an environment-wide layered approach” to security, starting with best practices for architecture and software and the layered use of various tools to thwart malicious attacks and malware (including NGAV, next-generation anti-virus; IPS/IDS, intrusion prevention and detection systems; and AMP, advanced malware protection, etc.).
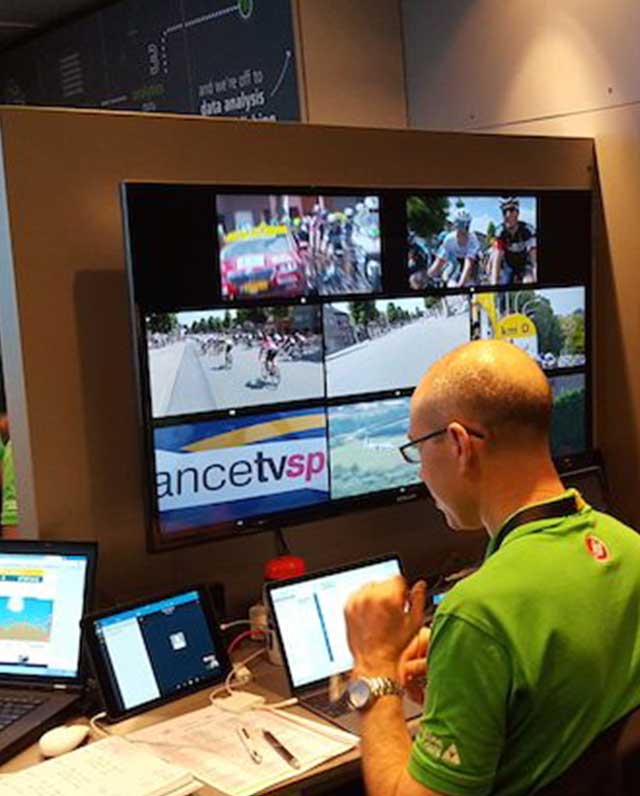
Behind the scenes of the Tour coverage inside the Dimension Data big data truck
The data is then fed into a real-time threat management platform provided by Dimension Data’s managed security services, Wade described in correspondence with WhatsYourTech.ca, where it is monitored 24×7 in a security operations centre. The data is correlated, and predictions are made based on information the team has on ongoing events on the Internet and dark Web. Potential threats can be dealt with before they become a problem.
This allows the delivery team to focus on the service and not have to worry about the security as it is fully managed, monitored and maintained.
“The Tour de France is a complex event,” Scott Gibson, Executive for Digital Business Solutions for Dimension Data, understated when describing the fast pace of the race and the data services his company provides. “Our mobile data centre and predictive analytics platform, combined with an incredibly passionate team, is really the driving force behind the innovation that we bring to the Tour every year. Often in the middle of nowhere, dealing with adverse weather conditions, we are proud to be able to produce instant and accurate real-time analytics and content that helps fans to better understand, follow and enjoy the race.”
The enjoyment started July 7 in Noirmoutier-en-l’Île, in western France, and the finish line for the Tour de France 2018 will be draped across the Champs-Élysées in Paris come July 29.
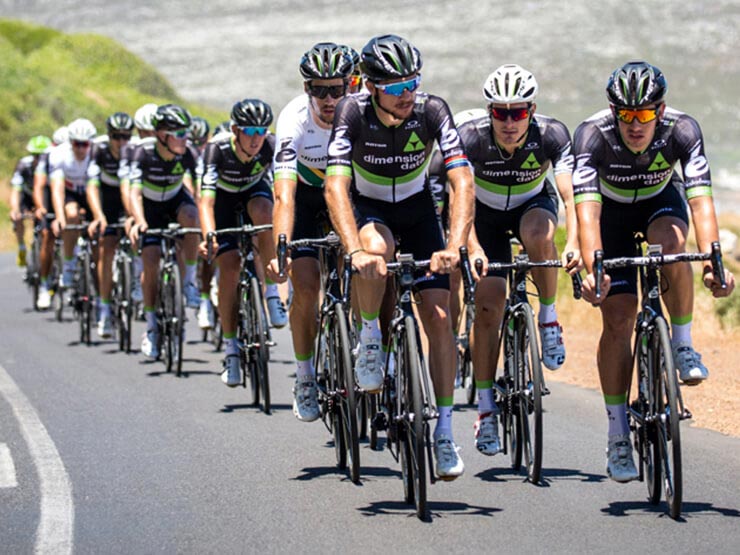
Team Dimension Data riders are tracked with speed and cadence sensors, heart rate monitors, GPS receivers and other devices to measure almost every aspect of their training. The data is recorded and analyzed by sports scientists and coaches.
-30-